Debugging in IntelliJ IDEA
When programming, things don't always run smoothly right away. That's exactly why IntelliJ IDEA has a debugger. It's a tool that allows you to examine your program step by step to find errors and understand how your code is actually executed.
What is a debugger?
A debugger is like a magnifying glass for your code. Instead of just running the program, you can pause the execution, look at individual variables, and go through the code line by line. This allows you to see where something is not working as you intended.
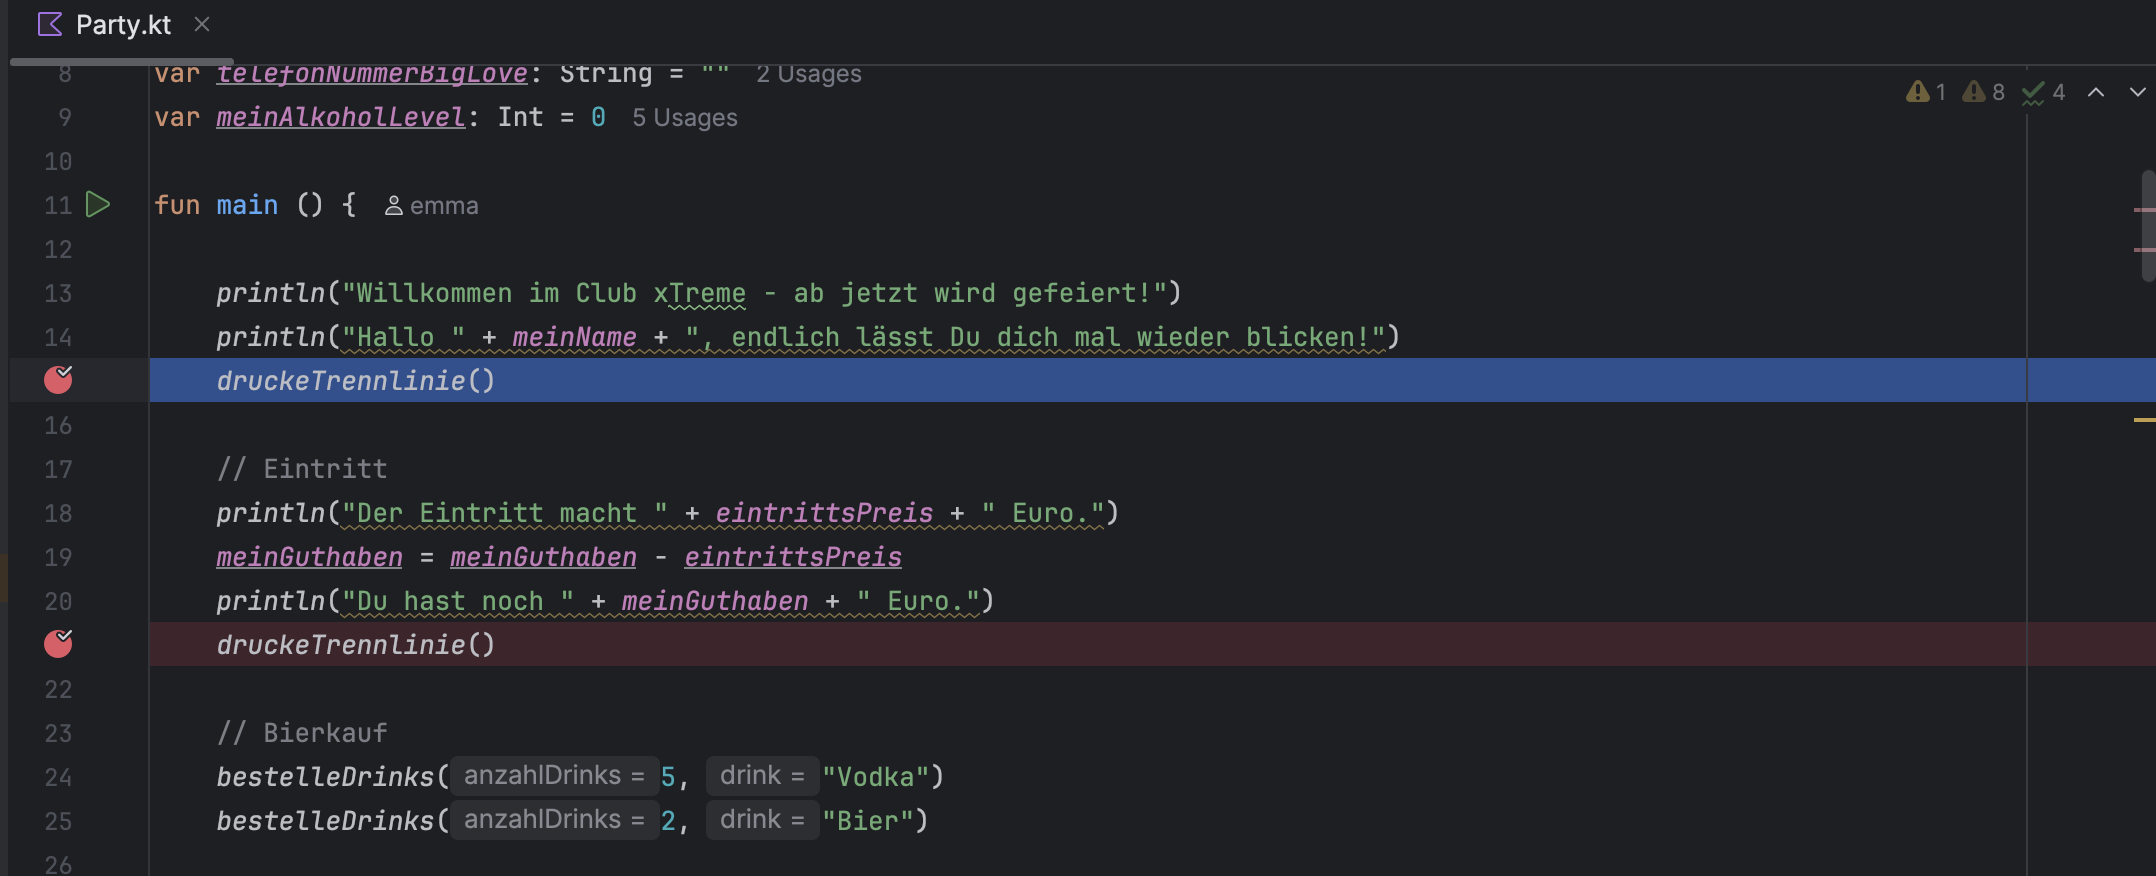
Setting breakpoints
The most important step in debugging is setting breakpoints.
- Click to the left of the line number where you want to pause the code.
- A red dot will appear – this is your breakpoint.
- When you start the program in debug mode, IntelliJ will pause at this exact point.
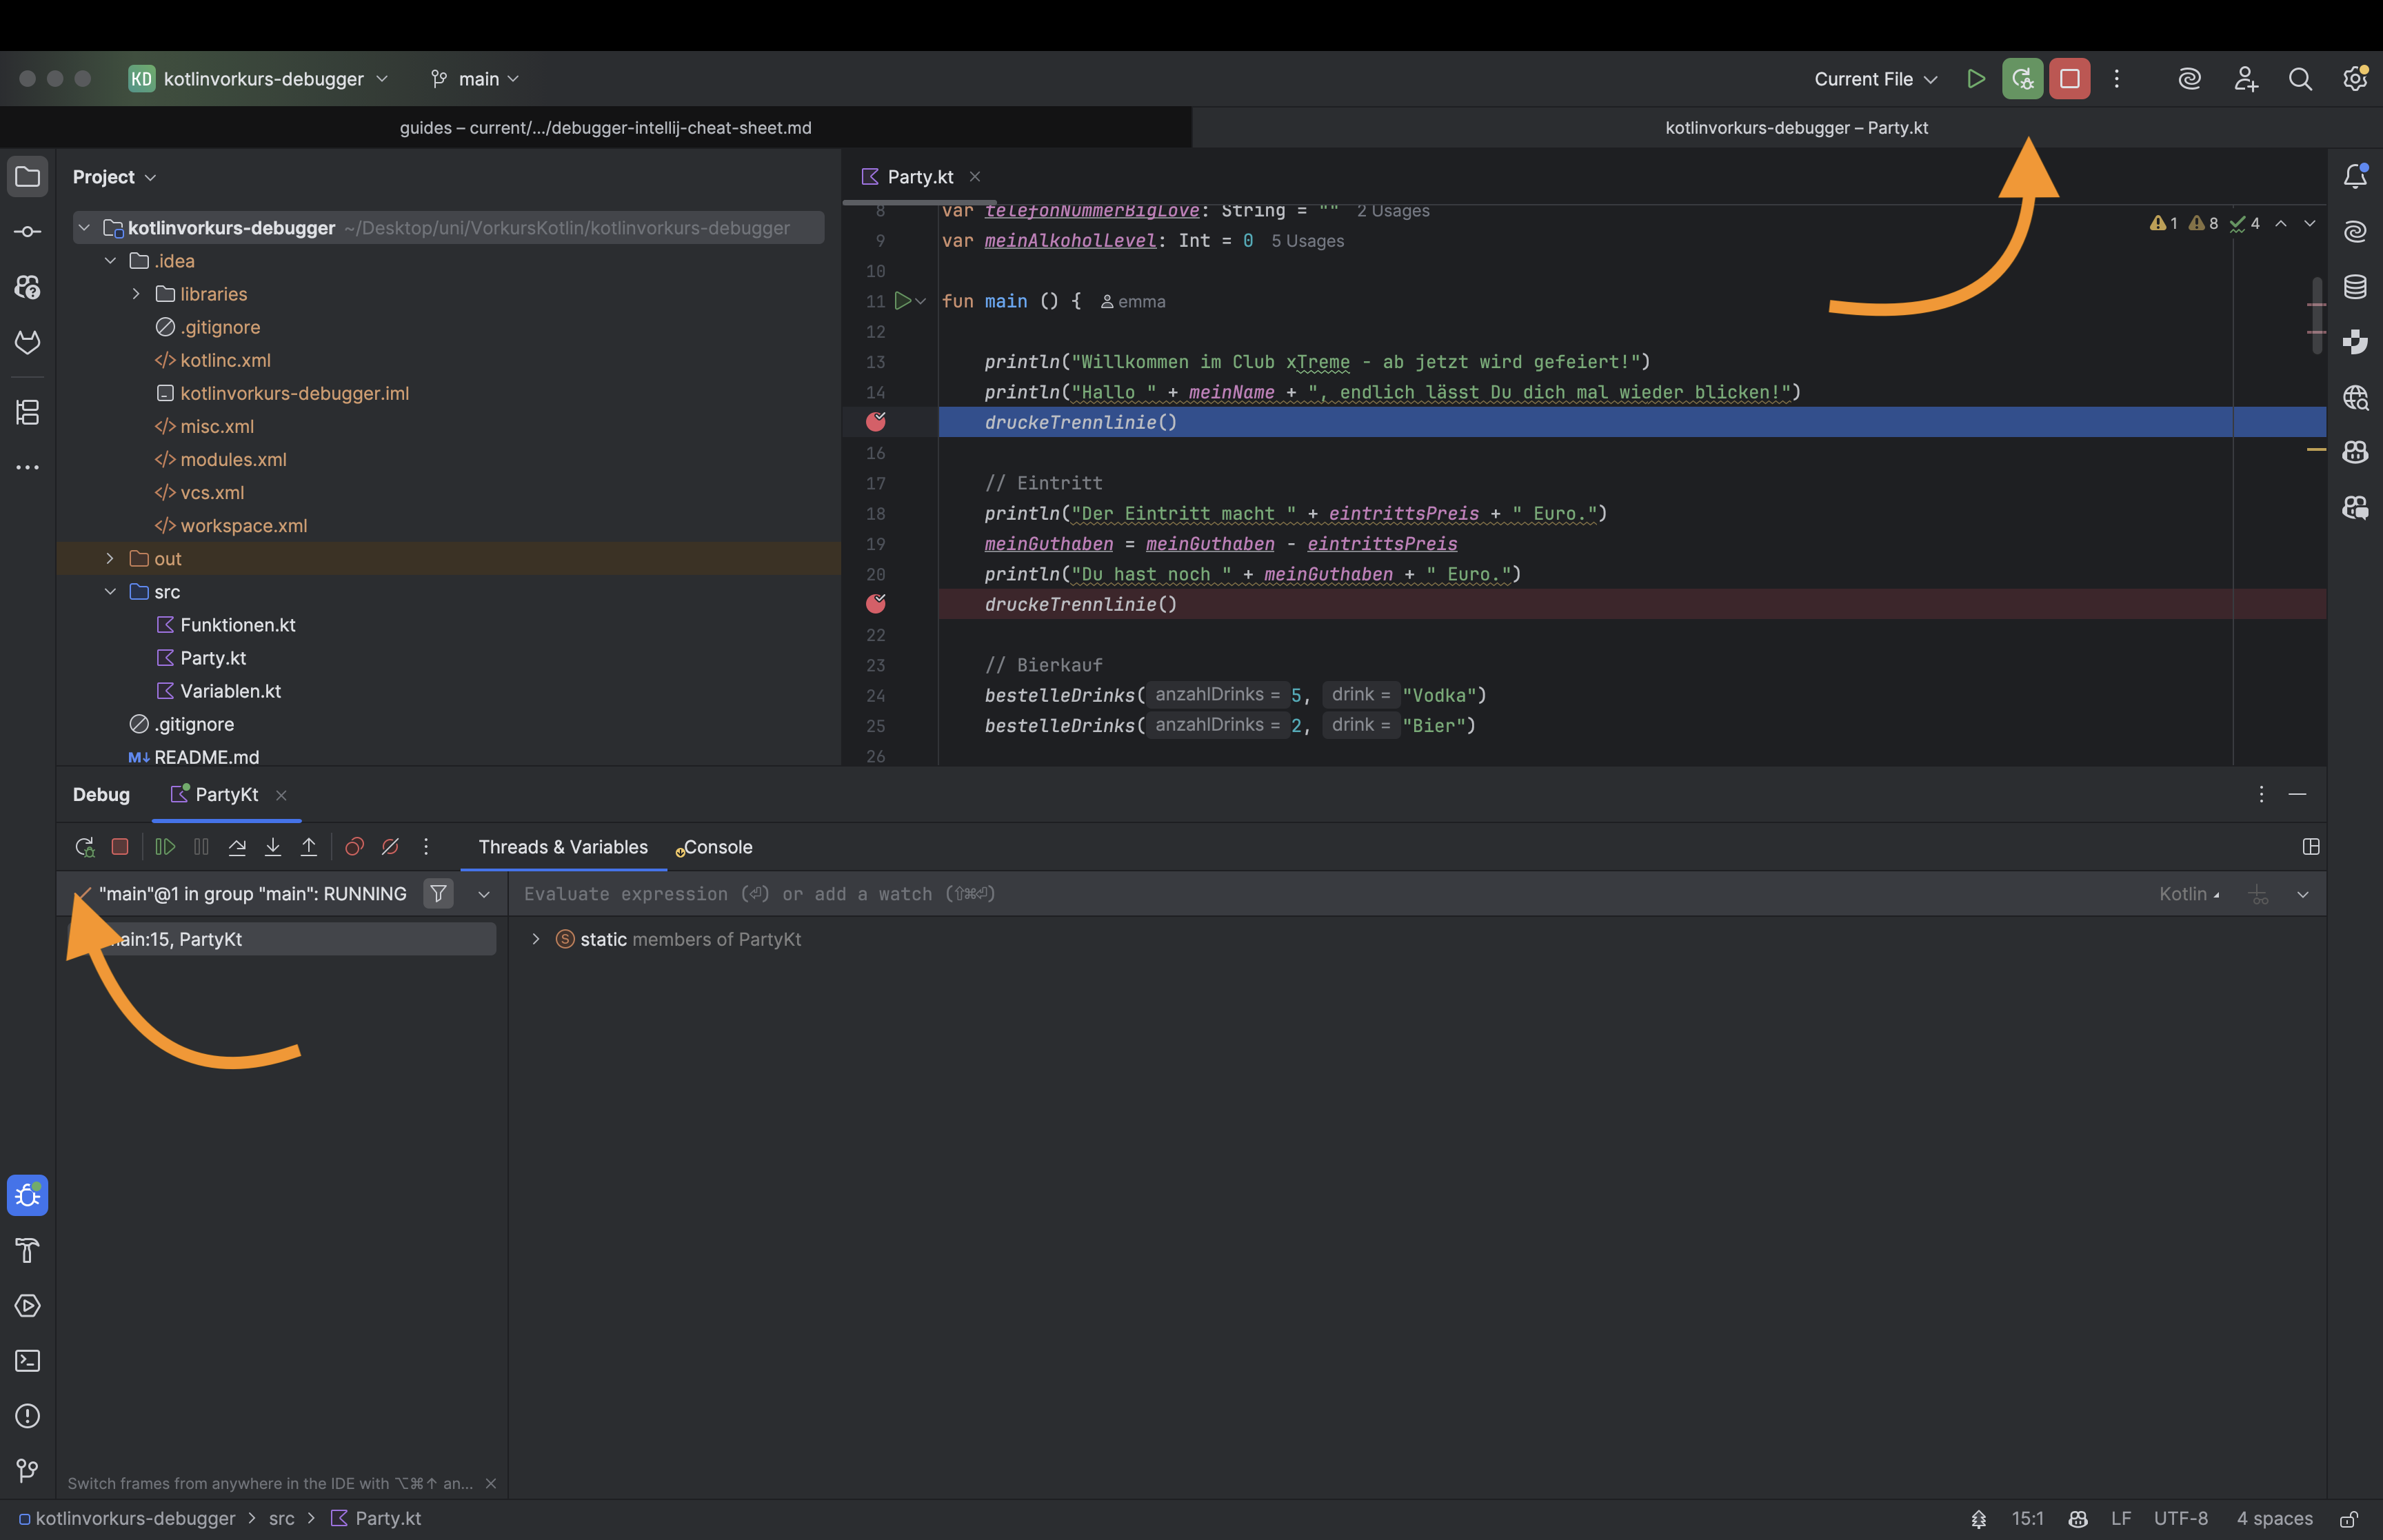
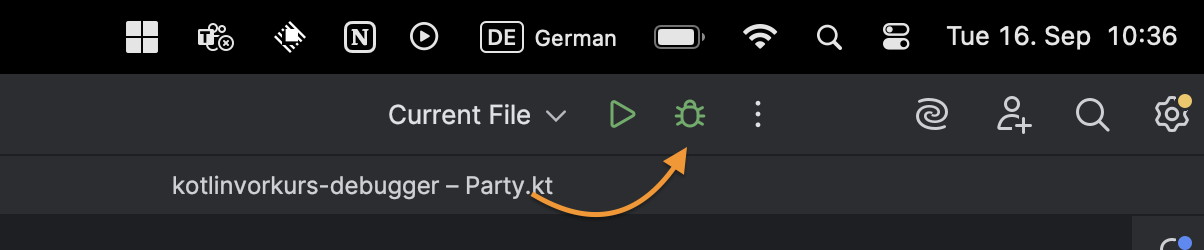
Start the program in debug mode
Instead of clicking the green arrow button as usual, press the bug button ("Debug"). Your program will now start with the debugger activated. As soon as it reaches a breakpoint, execution will stop and you can examine everything.
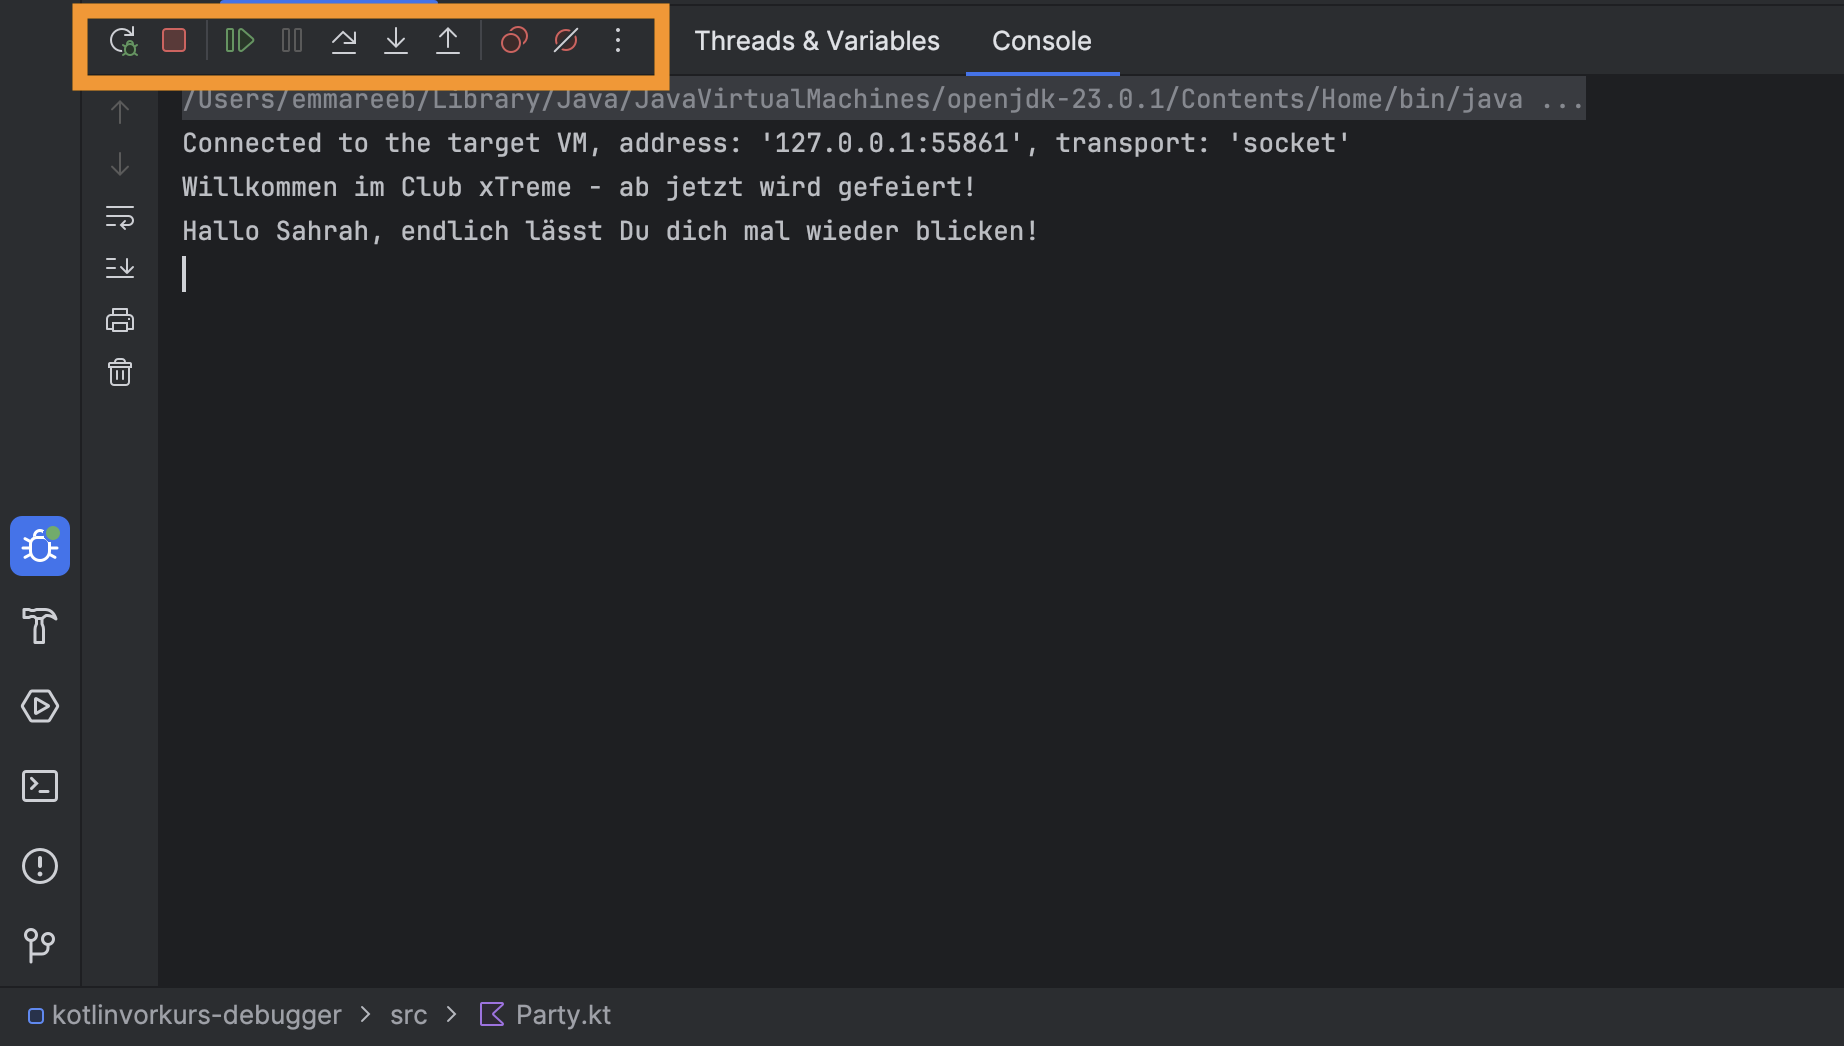
Go through the code step by step
When your program is paused, you have several options:
- Step Over (F8): Go to the next line without jumping into methods.
- Step Into (F7): Jump into a method to follow its execution.
- Step Out (Shift + F8): Exit the current method and return to the caller.
- Resume (F9): Let the program continue running until it reaches the next breakpoint or finishes.
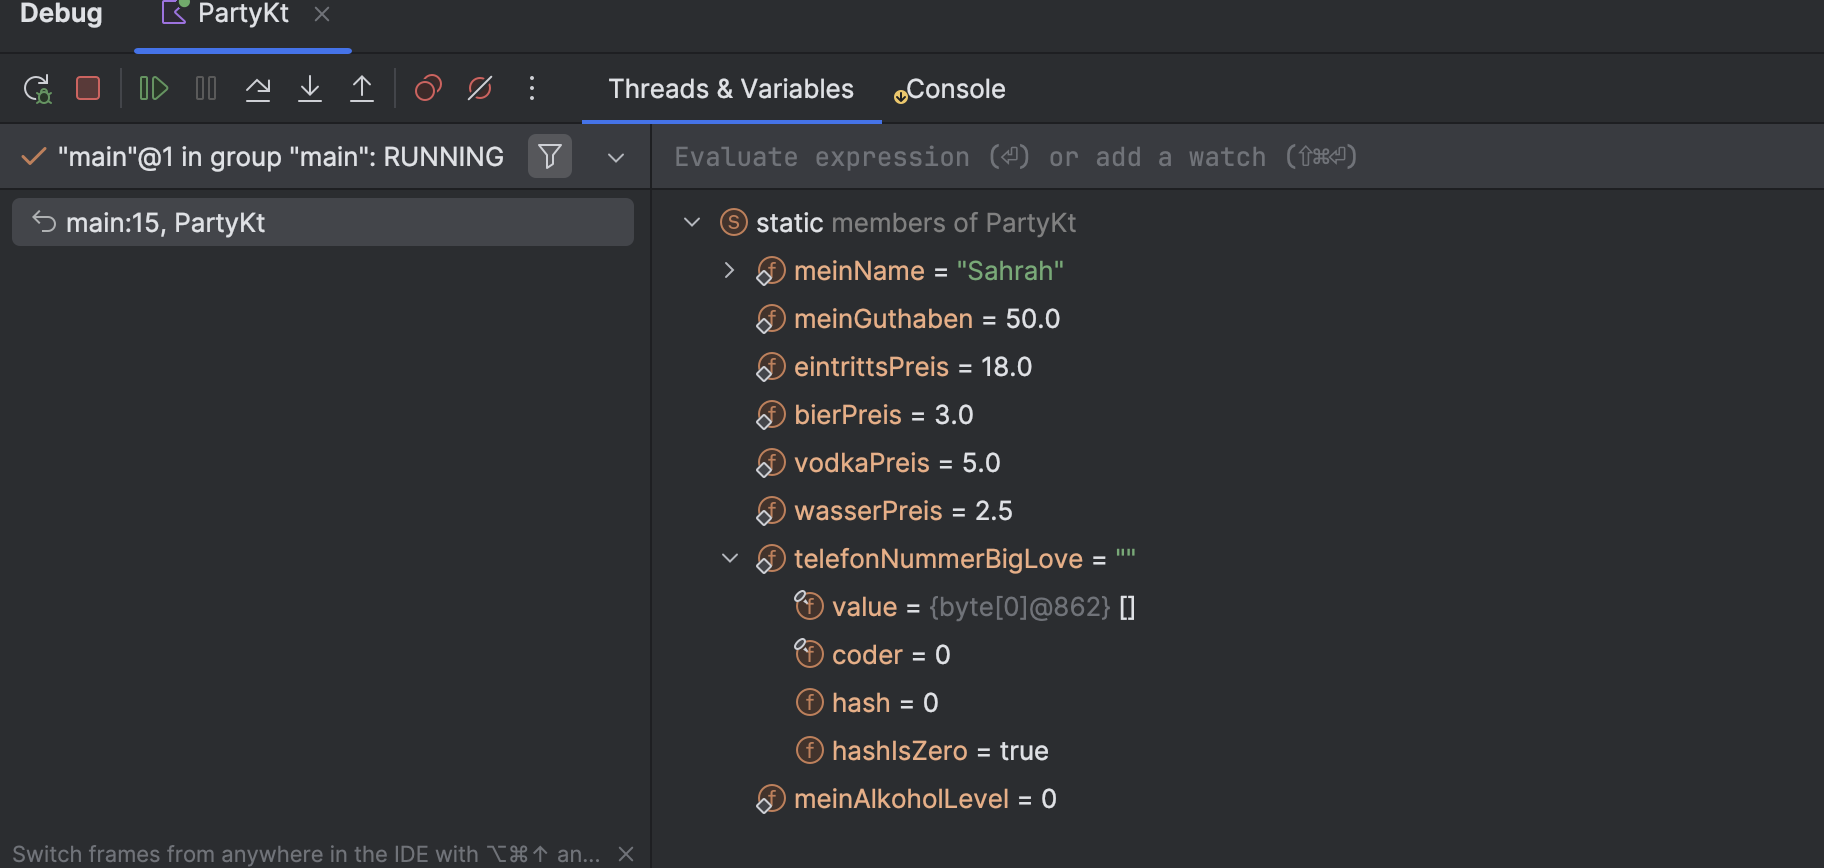
Monitor variables
While the program is paused, you can view the value of variables:
- In the debug window, you can see all current variables and their values.
- You can also monitor variables by adding them to the "Watches" area.
- A particularly useful feature is that you can even change values manually to see how this affects the rest of the program.
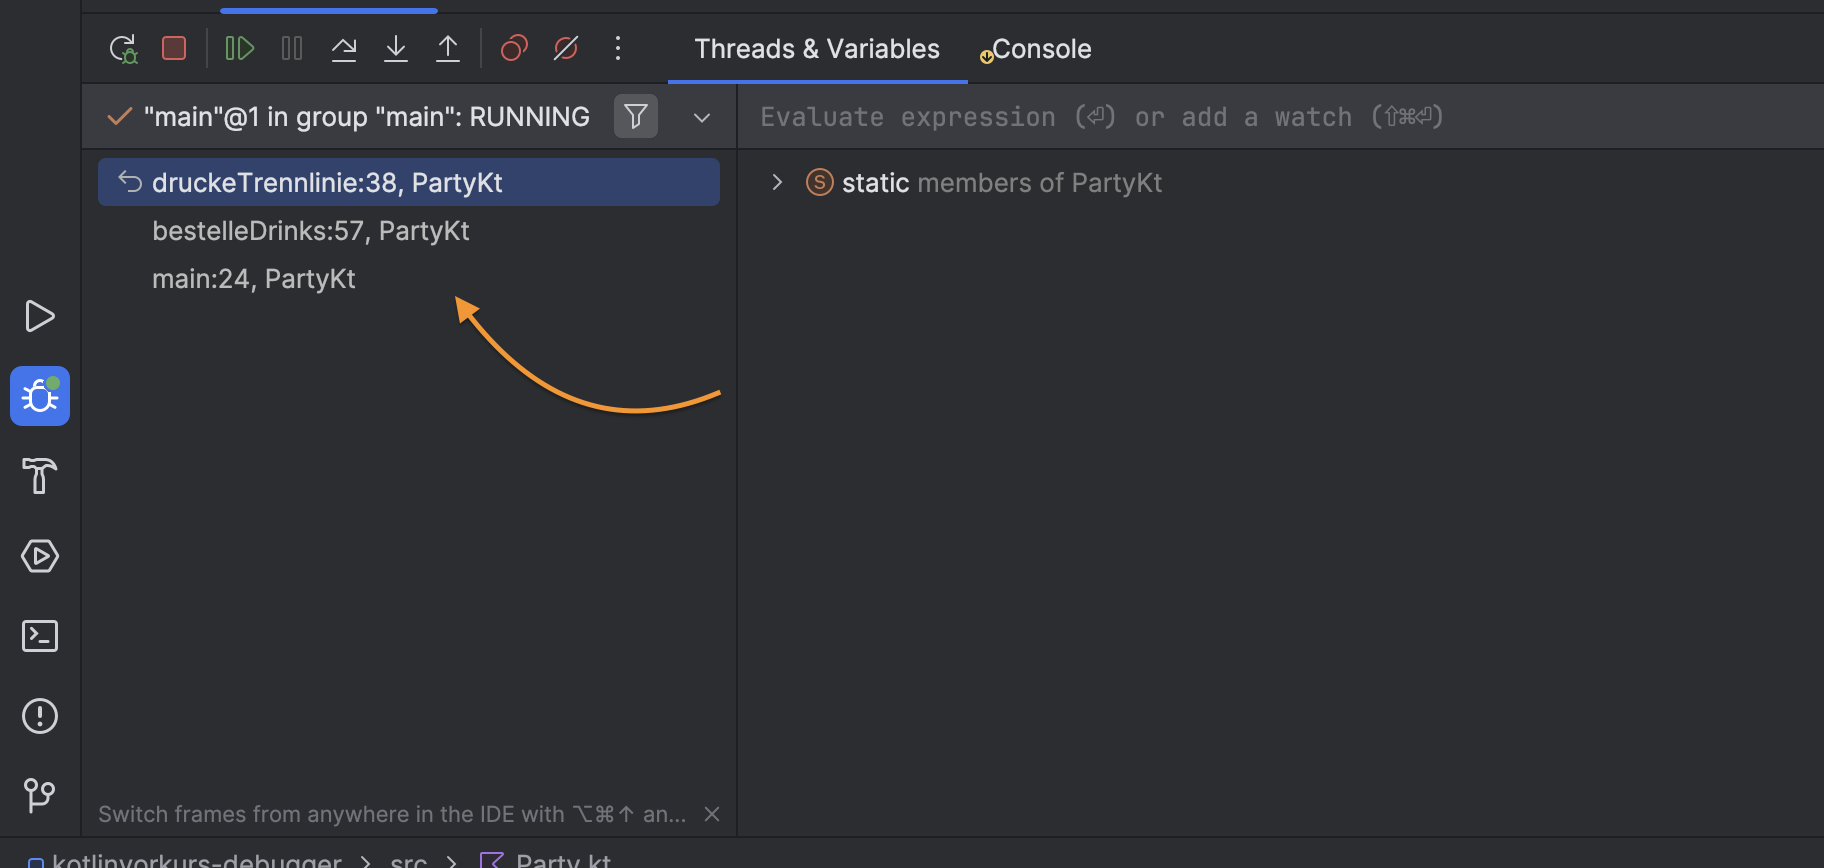
Understanding the call stack
The debugger also includes the call stack. This shows you which methods have been called and in what order. This helps you trace how your program got to its current location.
Conclusion
The debugger in IntelliJ is one of the most powerful tools you can use for programming. It allows you to find errors faster and develop a deeper understanding of your code at the same time. With a little practice, you will notice that debugging reveals almost more about your code than simple tests or console output. Video Tutorial)